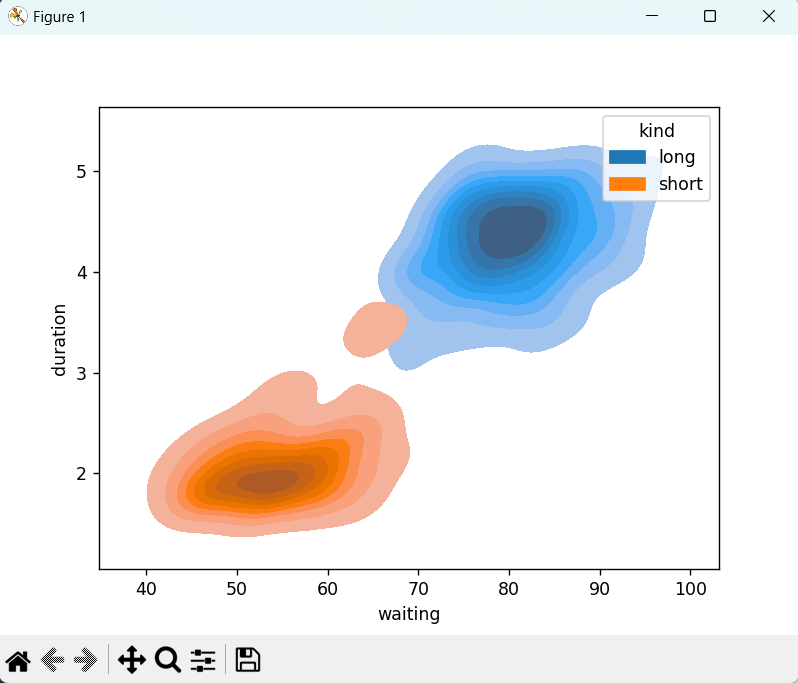
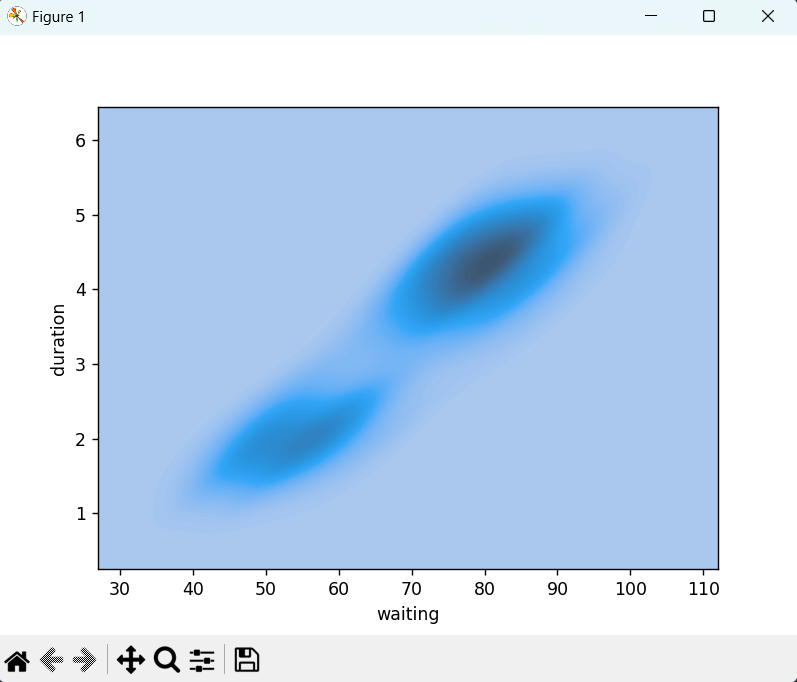
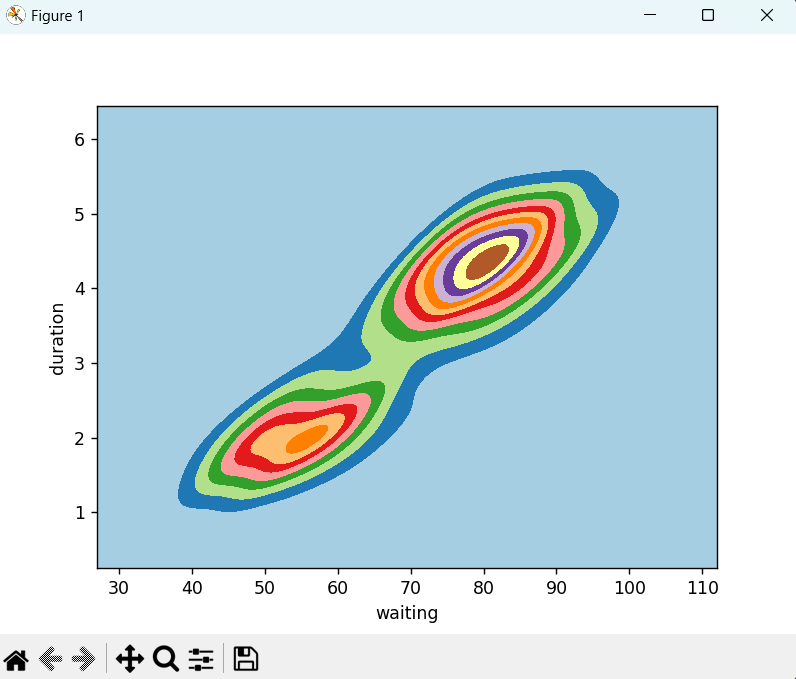
Unsure of the kinds of visual outputs I could create, I experimented with these KDE plots using seaborn. They were made by modifying the code from the official documentation.